
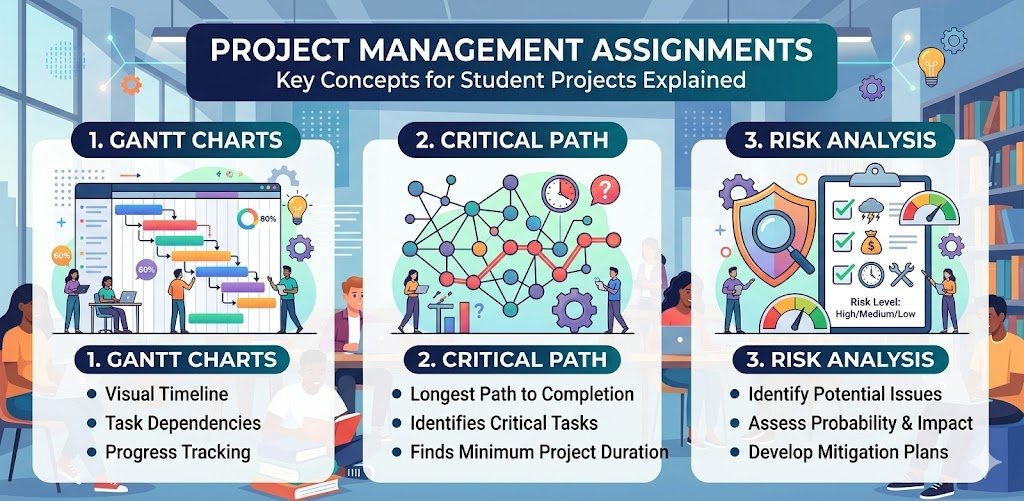
Gantt charts, critical path analysis, and risk assessment function as the 3 core project management tools for ensuring delivery within scope, budget, and timeline constraints. Project management provides the systematic framework for modern business operations, including software development, construction, and marketing campaigns.
Understanding project management, along with its tools & techniques, isn’t optional. It’s fundamental for business students and future managers.
Therefore, this guide explains the core project management tools, including Gantt charts, critical path analysis, and risk management, clearly.
Understanding Core Project Management Tools
Gantt charts, critical path analysis, and risk analysis constitute the 3 dominant components of project planning methodologies. These aren’t isolated techniques. They’re interconnected components of comprehensive project planning and control methodologies.
Together, they answer fundamental project questions:
Gantt Charts
Gantt charts are horizontal bar charts that display project schedules by plotting task bars against a linear timeline. These charts answer 3 specific scheduling questions:
- When does each specific task occur?
- How many days does each task require?
- Which tasks happen simultaneously?
When to use a Gantt Chart?
Use Gantt charts when your project management assignments require visualising project schedules, showing task sequences, illustrating dependencies between activities, or demonstrating timeline management. Apply them when developing comprehensive project plans, scheduling resources across phases, or presenting scheduling proposals requiring clear temporal visualisation showing when tasks occur.
Critical Path Analysis
Critical path analysis (CPA) is a mathematical technique for identifying the longest sequence of dependent tasks to determine the minimum project completion time. This method highlights activities where zero float exists.
Critical path analysis answers:
- What determines the minimum project duration?
- Which tasks cannot be delayed?
- Where should management focus attention?
When to apply or use CPA?
Use critical path analysis when your project management assignments require calculating minimum project duration, identifying schedule-critical tasks, or determining float availability. Apply it when optimising project timelines, prioritising resource allocation, justifying deadline feasibility, or explaining which activities constrain overall completion, requiring management focus.
Risk Analysis
Risk analysis is the systematic process of identifying 6 categories of project threats, such as technical failures, budget overruns, regulatory changes, resource outrun, schedule errors, and external uncertainties. This process utilises probability and impact matrices to reduce exposure to acceptable levels.
Risk analysis answers:
- What threatens project success?
- How likely are threats?
- What mitigation strategies reduce exposure?
When to conduct risk analysis?
Use risk analysis when your project management assignments require identifying project threats, assessing uncertainty impacts, or developing mitigation strategies. Apply it when creating risk registers, prioritising management attention, justifying contingency reserves, or demonstrating proactive planning addressing potential problems before they materialise into actual issues.
What is Project Management?
Project management is a professional discipline that utilises systematic approaches to plan, execute, monitor, and control temporary endeavours with defined objectives, timelines, and resource constraints.
As an academic subject, project management appears in business, engineering, construction management, and information technology programmes.
As a profession, project management involves leading cross-functional teams, allocating scarce resources strategically, managing diverse stakeholder expectations, and delivering outcomes meeting predetermined success criteria. Professional certifications, including PRINCE2, PMP (Project Management Professional), and Agile qualifications, validate project management competence globally, opening career opportunities across industries.
Core project management knowledge areas include:
Scope management, defining project boundaries, deliverables, and exclusions, preventing scope creep, and derailing timelines.
Time management, scheduling activities sequentially, estimating durations realistically, and identifying dependencies constraining flexibility.
Cost management, budgeting resources, forecasting expenditures, and controlling spending, ensuring financial viability.
Quality management, establishing standards, conducting inspections, implementing improvements, and meeting stakeholder requirements.
Risk management, identifying threats proactively, assessing probability and impact, and developing mitigation strategies to reduce exposure.
Stakeholder management, mapping influence and interest levels, engaging appropriately, managing expectations, and preventing resistance.
Communication management establishes information flow, reporting progress transparently, and facilitating collaboration across distributed teams.
Universities deliver project management through lectures covering theoretical models, tutorials applying frameworks to hypothetical scenarios, case studies examining real project successes and failures, and practical assignments producing professional project documentation.
FQ Assignment Help is available 24/7 to guide you whenever you need help with any of these project management knowledge areas.
Whenever your assignment requirements feel confusing, or planning tools seem complex, our project management assignment help connects you with UK-qualified specialists demonstrating proper application of Gantt charts, critical path analysis, and risk management techniques across diverse project scenarios.
What Project Management Assignments Include
Project management assignments test your ability to apply theoretical frameworks to practical planning scenarios. Unlike essays analysing concepts descriptively, these assignments demand producing professional documentation demonstrating planning competence.
Common assignment formats:
Project Plans: Outline scope statements, SMART objectives, deliverable specifications, and success criteria for hypothetical or real-world projects requiring systematic planning.
Work Breakdown Structures (WBS): Decompose projects hierarchically into manageable components, ensuring comprehensive coverage whilst preventing overlooked tasks undermining delivery.
Gantt Charts: Visualise project schedules showing task sequences, dependency relationships, duration estimates, and milestone achievements across project lifecycles.
Risk registers: Identify potential threats systematically, analysing probability and impact quantitatively, prioritising risks requiring attention, and proposing mitigation strategies to reduce project exposure.
Critical Path Analysis: Determining minimum project duration mathematically by identifying task sequences where delays directly extend overall timelines, highlighting areas requiring close monitoring.
Resource Allocation Plans: Distribute personnel, equipment, and budget across project phases, ensuring availability when needed whilst avoiding over-allocation, creating bottlenecks.
Stakeholder Analysis: Mapping project stakeholders systematically, assessing their power and interest levels, and developing engagement strategies to maintain support throughout project lifecycles.
For comprehensive guidance on structuring project management assignments that meet UK university academic standards, explore our detailed guide on how to structure and plan your assignment, covering formal writing conventions.
Let’s get deeper into Gantt charts, critical path analysis, and risk analysis.
Gantt Charts: Visualising Project Schedules
Henry Gantt developed the Gantt Chart in the 1910s for manufacturing scheduling. This visualisation technique remains the most widely used project scheduling tool globally. Every professional project manager creates Gantt charts. Every assignment expects them.
Core Components Of Gantt Charts
Understanding Gantt chart elements ensures accurate construction and professional presentation.
Task list appearing down the left side, identifying all project activities from initiation through closure, organised hierarchically, showing major phases and subordinate tasks beneath them.
Timeline scale running horizontally across the top showing days, weeks, or months depending on project duration, providing temporal context for all scheduling.
Task bars extending horizontally from start dates to finish dates, with length representing task duration and position showing when tasks occur relative to project start.
Dependency arrows connecting task bars showing logical relationships. Finish-to-start (most common), start-to-start, finish-to-finish, or start-to-finish, constraining scheduling flexibility.
Milestones appearing as diamond symbols or vertical markers indicating significant achievement points like phase completions, client approvals, or delivery deadlines requiring no duration themselves.
Progress indicators using shading, colour fills, or percentage labels within task bars show completion status, enabling comparison between planned schedules and actual progress.
Resource assignments sometimes appear alongside task names, identifying personnel, equipment, or teams responsible for completing specific activities.
Types of Gantt Charts for Different Purposes
Different project contexts require different Gantt chart approaches, balancing detail with clarity.
Simple Gantt charts suit small projects with few tasks (under 20 activities), focusing strictly on timelines and completion status without showing complex dependency relationships. Best for straightforward projects where task sequencing is obvious.
Progress Gantt charts use shading or colour-coding within task bars representing completion percentages. A vertical “today” line helps compare current progress against planned schedules, immediately highlighting delays requiring management attention.
Dependency-based Gantt charts emphasise how tasks relate through arrows or lines showing one task must finish before another starts, helping identify critical paths where delays cascade through dependent activities.
Resource-loaded Gantt charts include details on resource allocation, showing specific team members, equipment, or budgets assigned to each task, enabling resource levelling and preventing over-allocation.
Milestone Gantt charts focus on high-level checkpoints and major achievements (shown as diamond symbols) rather than detailed sub-tasks, providing an executive-level overview without overwhelming detail.
Agile Gantt charts designed for iterative work focus on sprints and releases, showing task story points and status within flexible timelines rather than rigid long-term plans accommodating changing requirements.
Multi-project Gantt charts allow managers overseeing several projects simultaneously on one timeline, comparing progress and managing resources across entire portfolios, preventing conflicts.
Common Dependency Types in Gantt Charts
Understanding dependency logic ensures realistic scheduling reflecting actual work constraints.
Finish-to-Start (FS) is the most common dependency type, where Task B cannot start until Task A finishes completely. Example: “Pour concrete foundation” must finish before “Build walls” starts.
Start-to-Start (SS) means Task B cannot start until Task A has also started, though they can overlap. Example: “Develop training materials” and “Schedule training sessions” can start simultaneously.
Finish-to-Finish (FF) indicates that Task B cannot finish until Task A finishes, though both can run concurrently. Example: “Quality testing” cannot finish until “Software development” finishes.
Start-to-Finish (SF) is rarely used, meaning Task B cannot finish until Task A starts. Example in shift work: “Night shift” cannot finish until “Day shift” starts.
Critical Path Analysis (CPA): Finding Project Duration
Also called the Critical Path Method (CPM), this technique calculates the minimum possible project duration whilst identifying tasks requiring the closest monitoring. Any delay on the critical path delays the entire project.
Steps in Critical Path Analysis
Conducting CPA systematically ensures accurate minimum duration calculations.
Step 1: Define project scope completely
Break projects down into comprehensive activity lists using Work Breakdown Structures (WBS). Each task needs clear descriptions and specific deliverables. Missing tasks invalidate CPA calculations entirely.
Step 2: Identify task dependencies
Determine logical task order, identifying which activities must finish before others begin. Use the four dependency types (finish-to-start, start-to-start, finish-to-finish, start-to-finish) accurately reflecting real constraints.
Step 3: Estimate task durations
Assign realistic time estimates based on historical data, expert judgment, or industry standards. For uncertain projects, use PERT (Program Evaluation and Review Technique) employing three estimates, including optimistic, most likely, and pessimistic, calculating weighted averages.
Step 4: Create network diagrams
Visualise tasks and dependencies in network diagrams (also called logic diagrams or precedence diagrams). Tasks appear as boxes (nodes) and dependencies as arrows connecting them, showing project flow logically.
Step 5: Calculate early and late times
Perform two mathematical passes through network diagrams, finding specific time markers for every task:
Forward pass calculates Earliest Start (ES) and Earliest Finish (EF) for each task, moving from project start to end. ES for the first task equals zero. EF equals ES plus task duration. When multiple tasks feed into one successor, the successor’s ES equals the latest EF from predecessors.
Backward pass calculates Latest Start (LS) and Latest Finish (LF) without delaying projects, working from end dates back to starts. LF for final tasks equals their EF. LS equals LF minus task duration. When one task feeds multiple successors, its LF equals the earliest LS from successors.
Step 6: Determine total float (slack)
Calculate Float (or Slack) for each task, showing how much delay is tolerable without extending project duration. Float = LS – ES (or LF – EF, giving identical results).
Critical path is the sequence where Float equals Zero. Any delay in critical tasks immediately delays entire projects. These require the closest monitoring and the fastest problem resolution.
Benefits of Critical Path Analysis
CPA provides multiple management advantages beyond simple duration calculation.
Resource prioritisation enables managers to allocate personnel, equipment, and budget to critical tasks, ensuring they are completed on time whilst allowing non-critical tasks flexibility, absorbing delays without project impact.
Schedule compression when deadlines move up uses techniques like crashing (adding resources to critical tasks) or fast-tracking (performing sequential critical tasks in parallel), specifically on critical paths, shortening timelines efficiently.
Risk management highlights the most sensitive project areas, allowing proactive monitoring, contingency planning, and early intervention, preventing delays from materialising into project failures.
Communication clarity provides stakeholders with clear roadmaps showing which activities drive project duration, helping justify resource requests and explain delay impacts objectively.
Types of Paths in Projects
Understanding different path types helps prioritise management attention appropriately.
Critical path is the longest sequence with zero float, determining the minimum project duration. Changes here immediately affect completion dates.
Near-critical path contains sequences with very low float (1-2 days) that could easily become critical if small delays occur, requiring close monitoring.
Non-critical path includes sequences with positive float, offering scheduling flexibility, allowing resource reallocation to critical tasks when needed.
Risk Analysis: Managing Project Uncertainties
Projects face constant uncertainties. Markets change. Resources become unavailable. Technologies fail. Requirements shift. Risk analysis moves managers from reactive crisis management to proactive threat mitigation.
Steps in Project Risk Analysis
Conducting risk analysis systematically ensures comprehensive threat coverage.
Step 1: Identify potential risks
List all possible internal and external events disrupting projects. Use brainstorming sessions with project teams, historical data from similar past projects, expert interviews with experienced practitioners, and checklists covering common risk categories.
Risk categories include 6 specific domains:
- Technical risks (technology failures, integration problems)
- Financial risks (budget overruns, funding cuts)
- Legal risks (regulatory changes, contract disputes)
- Resource risks (personnel turnover, equipment breakdowns)
- Schedule risks (critical path delays, dependency failures)
- External risks (market changes, natural disasters)
Step 2: Perform qualitative risk analysis
Prioritise risks based on subjective impact and likelihood using descriptive scales like Low-Medium-High or numerical ratings 1-5.
Risk matrices plot risks on grids where one axis shows Probability (likelihood of occurrence) and the other shows Impact (severity if it occurs). Common matrix sizes are 3×3 or 5×5.
Risk scoring multiplies probability by impact, producing numerical scores prioritising attention. Example: “Critical” impact (5 points) with “Likely” probability (4 points) yields a risk score of 20, demanding immediate mitigation planning.
Colour coding (green-yellow-red) helps visualise risk severity quickly, focusing management attention on high-priority threats.
Step 3: Perform quantitative risk analysis
For complex projects, use numerical data and statistical models quantifying specific risk effects on project targets.
Monte Carlo simulation is a computational technique. It models the probability of various outcomes in a process. It runs thousands of project iterations, varying task durations and costs randomly within specified ranges, estimating probabilities of finishing by certain dates or within specific budgets, producing probability distributions showing likely outcomes.
Expected Monetary Value (EMV) calculates average outcomes in financial terms using the formula: EMV = Probability × Impact. Example: 30% probability of a £50,000 cost overrun yields EMV of £15,000, informing contingency reserve requirements.
Decision tree analysis evaluates multiple decision paths considering probabilities and outcomes at each branch, helping choose strategies maximising expected value or minimise risk exposure.
Step 4: Plan risk responses
Develop strategies to manage prioritised risks appropriately based on their characteristics.
Mitigation takes active steps reducing probability or impact through preventive actions. Example: using experienced staff for critical tasks reduces technical failure probability.
Transference shifts risk to third parties through insurance policies, fixed-price contracts, warranties, or outsourcing arrangements, though typically at additional cost.
Avoidance changes project plans, eliminating threats by removing risky activities, choosing alternative approaches, or changing project scope.
Acceptance acknowledges risks exist but decides not to act unless they occur, typically establishing Contingency Reserves (extra time or money) covering potential impacts if risks materialise.
Step 5: Monitor and control risks
Risk analysis isn’t a one-time activity. Project managers must continuously track Risk Registers, identify new threats as environments change, reassess existing risk ratings as projects progress, and evaluate response plan effectiveness.
Regular risk reviews during project meetings ensure risks receive ongoing attention. Trigger conditions specify when contingency plans activate. Risk owners assigned to each threat ensure accountability for monitoring and response execution.
Conclusion
Mastering these project management tools and techniques demonstrates professional competence, which assessors reward with distinction grades. Practice creating Gantt charts for realistic scenarios. Calculate critical paths manually before using software. Develop comprehensive risk registers with justified response strategies.
Your project management grades matter for your business career. Therefore, FQ Assignment Help provides professional support from PRINCE2 and PMP-qualified specialists who demonstrate industry-standard Gantt chart construction, mathematically accurate critical path analysis, and comprehensive risk management techniques, delivering the assignment quality and professional competence, securing distinction grades whilst preparing you for real-world project leadership roles.
Join thousands of students who rely on our free guides for assignment help, exam strategies, and subject-specific support. We publish new resources, covering everything from engineering calculations to business essay techniques, and practical insights supporting your academic journey. Stay connected with us and never miss updates.